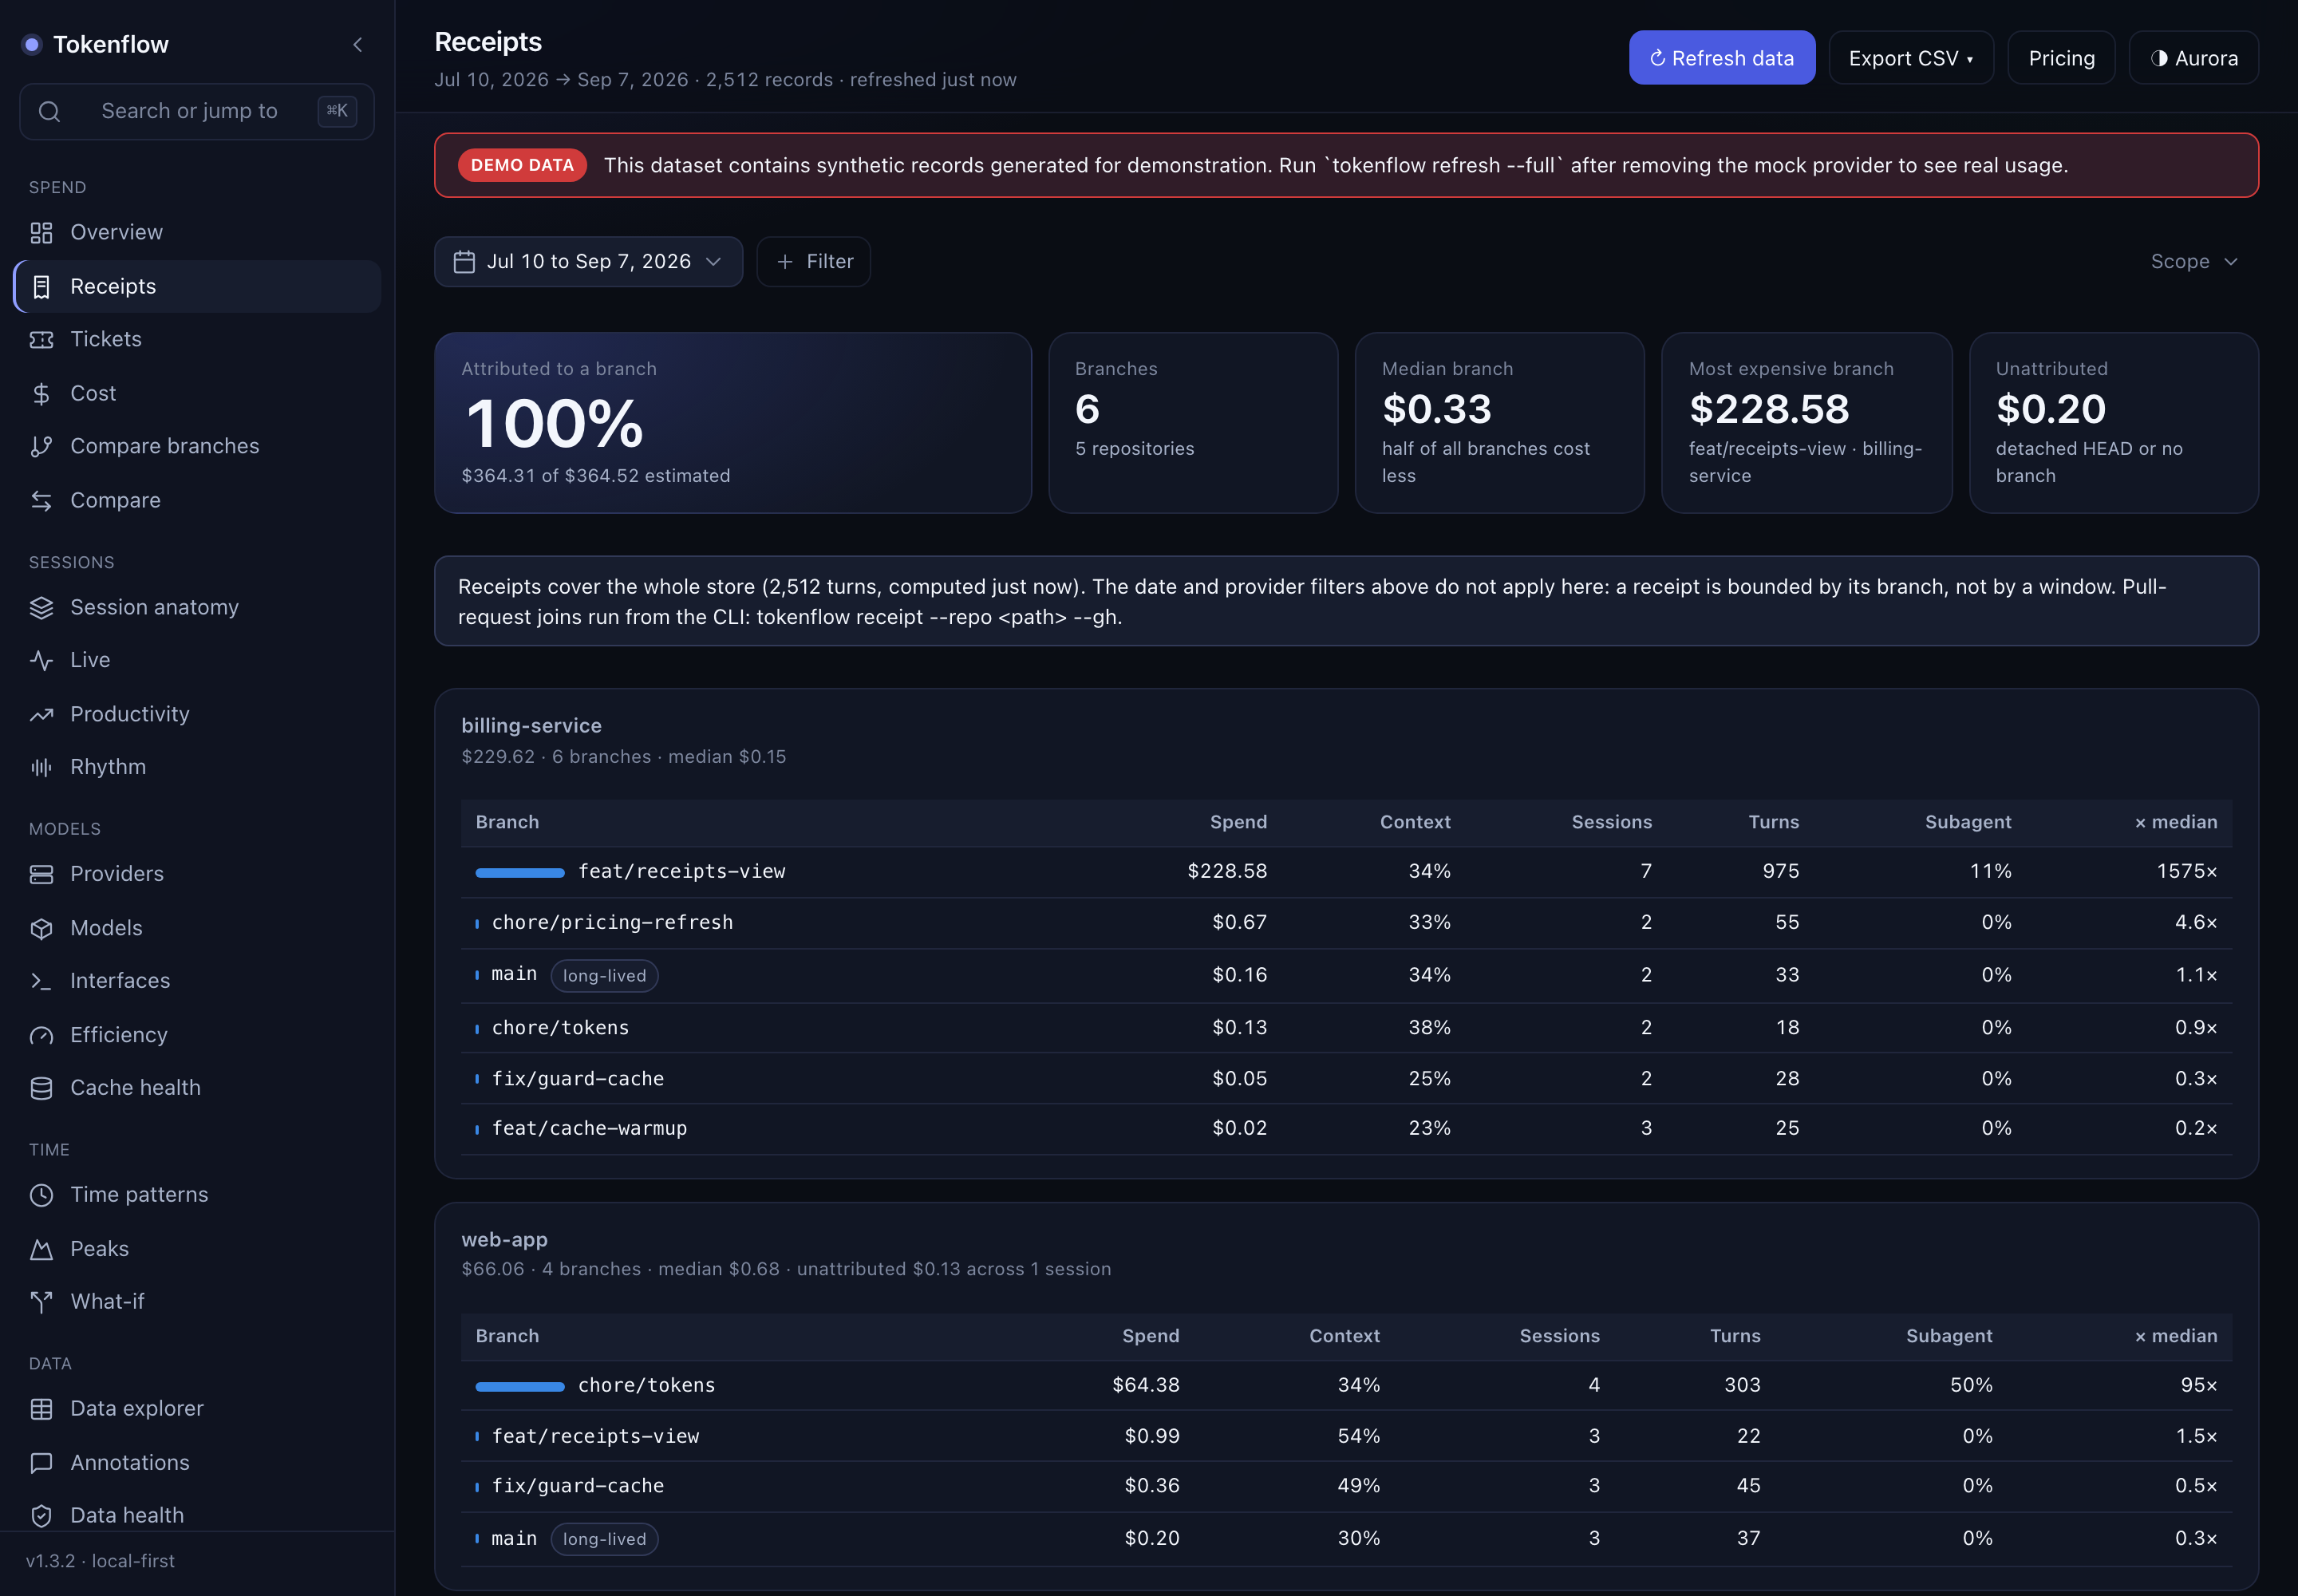
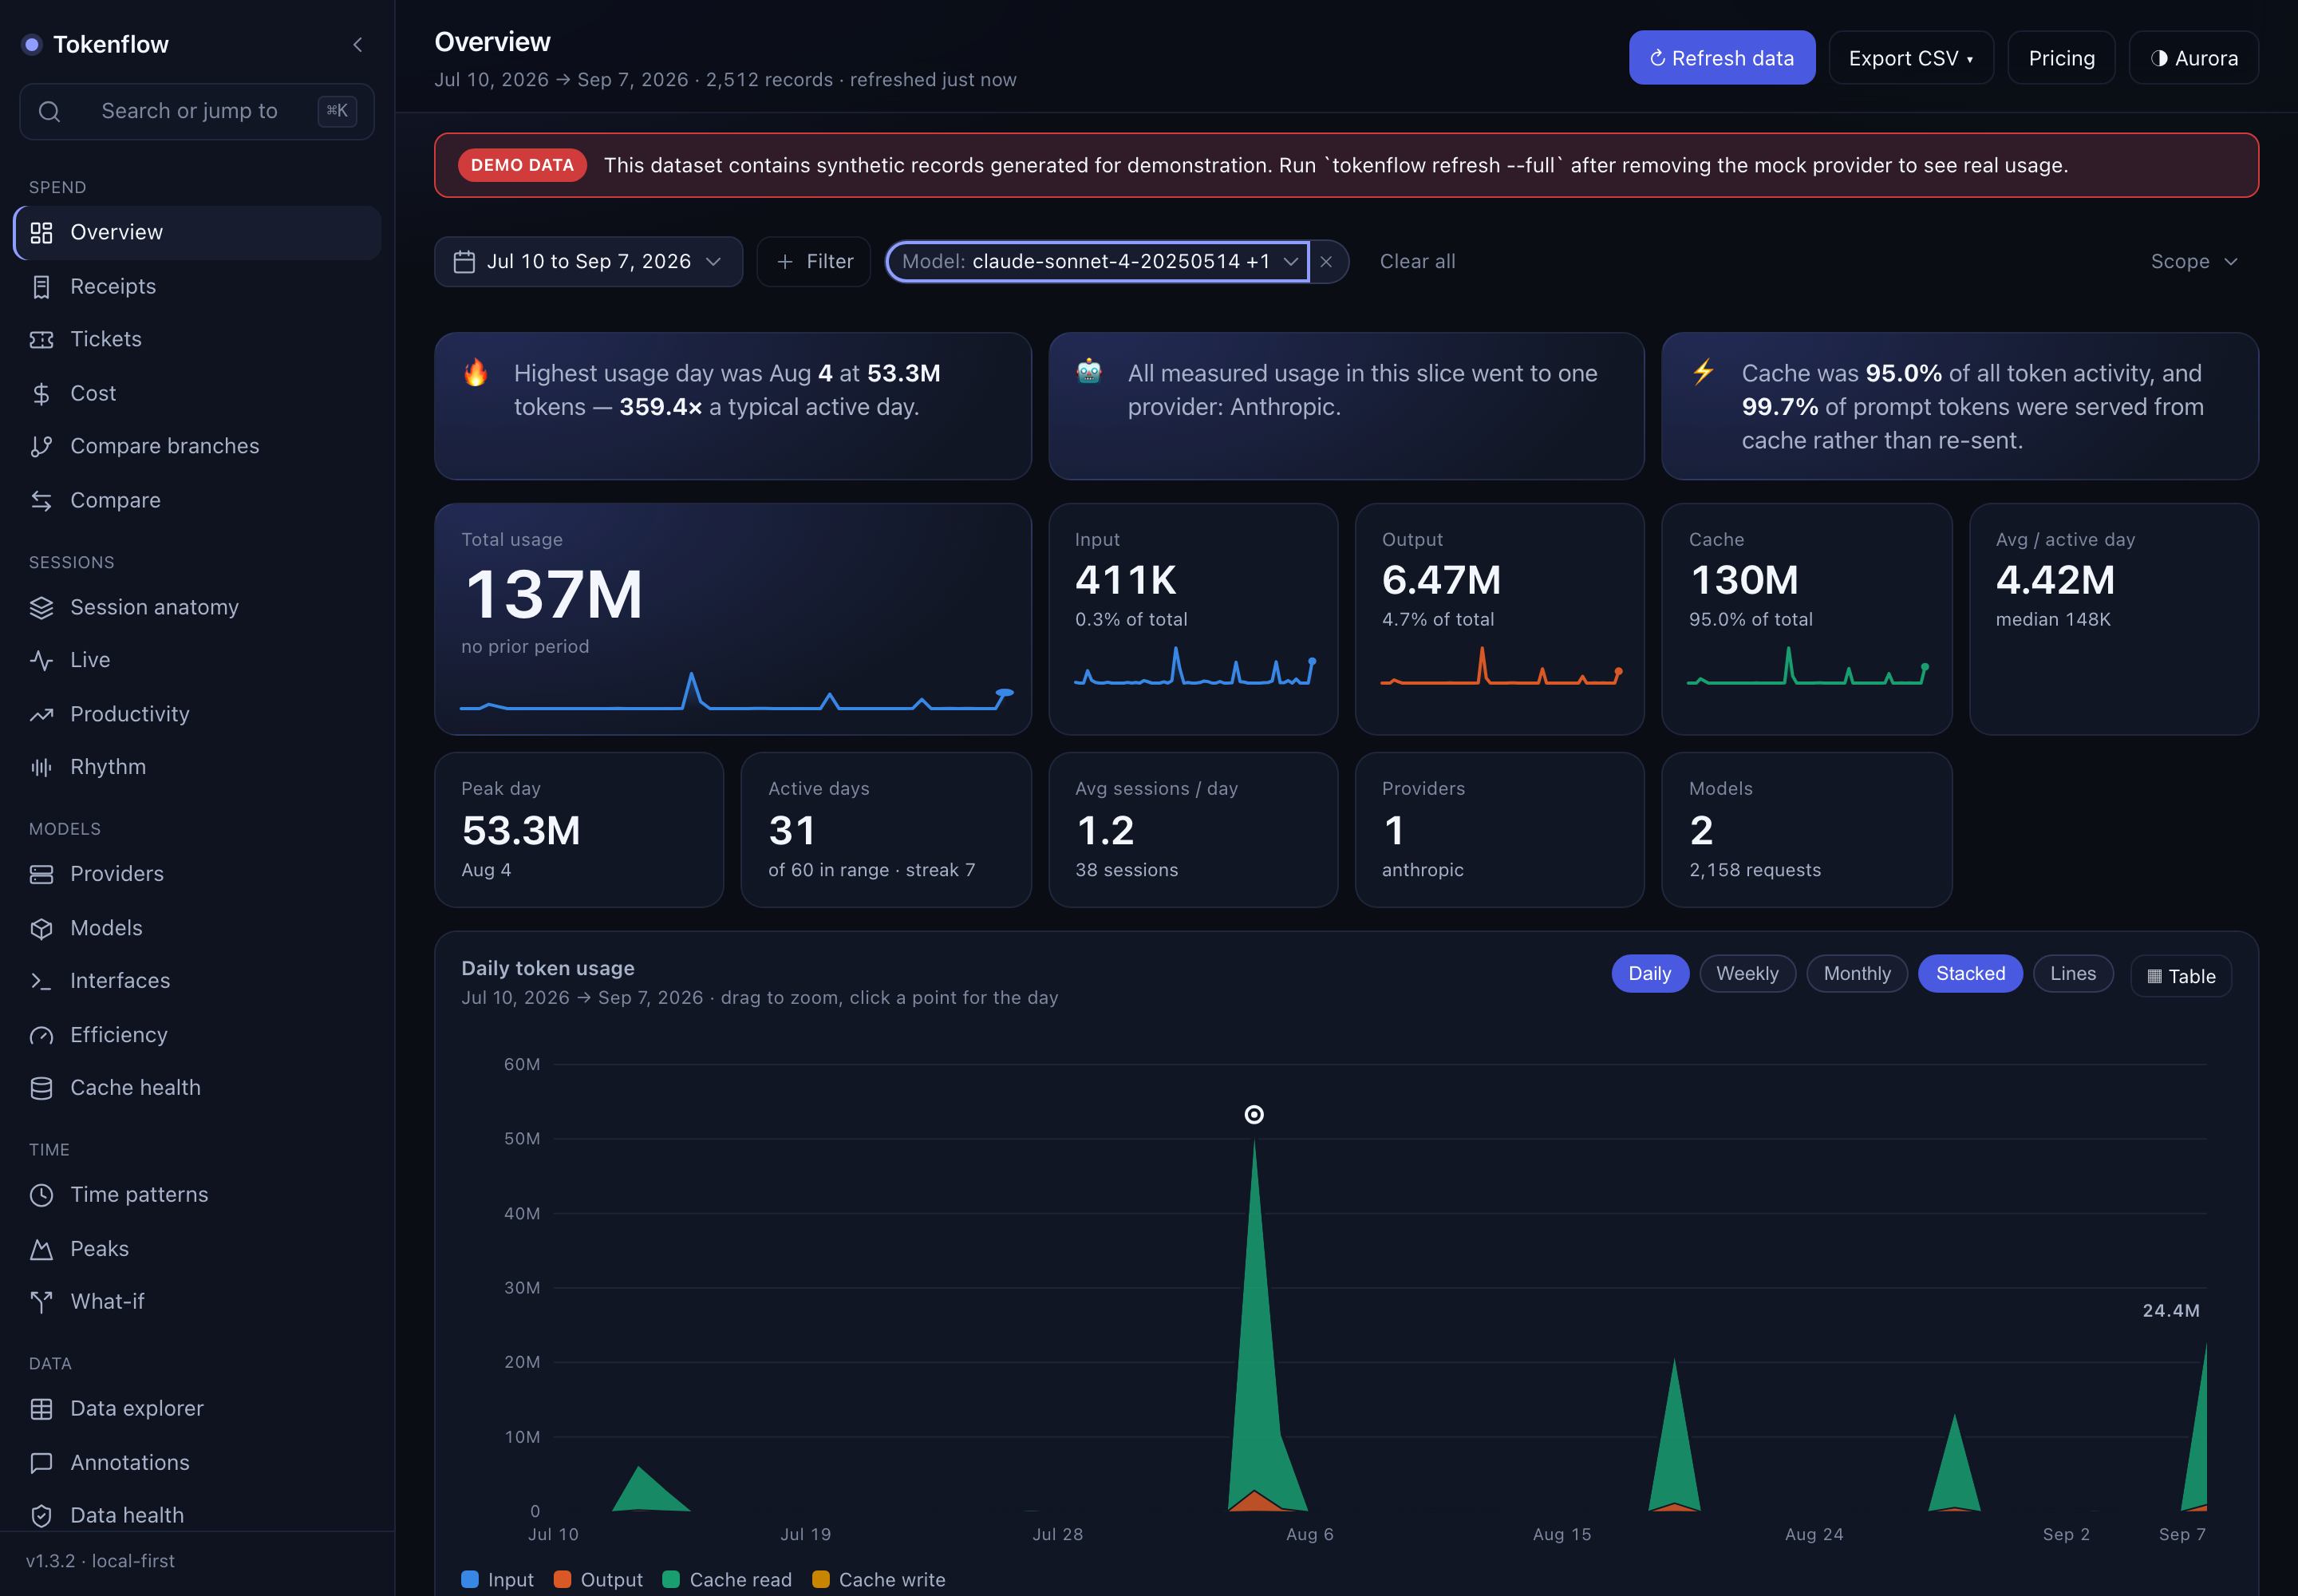
TokenFlow reads the logs your tools already write and turns them into honest analytics across Claude Code, Codex, OpenCode, Cursor and more. Zero dependencies. Nothing leaves your machine.
145 tests on every push · macOS, Linux, Windows · no API keys, no telemetry
Features
12+
Daily series, composition, provider and model intelligence, interfaces, hour and weekday patterns, calendar heatmap, peaks, efficiency ratios and more.
$ est + $ real
Estimated cost from a versioned price table with sources printed, cross-checked against measured gateway costs where they exist.
5h
Claude and Codex style five hour session windows modelled from your activity, with reset countdowns right in the menu bar.
ETA
Declare caps in config and get capacity meters, burn rates, exhaustion ETAs, linear forecasts with stated confidence, and anomaly alerts with arithmetic shown.
r = ?
Pearson correlation between token spend and git activity, labelled as correlation with n stated, never dressed up as productivity.
1 file
The whole dashboard inlines into one HTML file: CSS, chart code and data. Opens from disk forever, no server needed.
Δ compare
Diff any two time windows metric by metric, plus first-seen models, streaks and milestone tracking.
3 skins
Each in dark and light, colour-blind validated per mode so switching themes never changes what a colour means.
Under the hood
Every layer is built for honesty: adapters that only read, accounting that never double counts, prices with receipts, and tests that enforce all of it.
10
Anthropic, Codex, OpenCode, Hermes, Cline, Cursor, gateway overlays, git, generic CSV/JSONL/SQLite import — incremental and resumable at the byte offset.
145
Cache-bucket exclusivity, stream dedup, null-vs-zero semantics and pricing rules are asserted on every push across three OSes.
12
KPIs, composition, provider/model intelligence, time patterns, peaks, efficiency, cost with coverage, correlations, compare, explorer, data health.
3
A loopback web dashboard, a native Swift menu bar app with capacity forecasting, and a scriptable CLI — all reading the same pre-aggregated cube.
Why TokenFlow
Most token dashboards sum whatever they find. On real data that inflates usage by orders of magnitude. TokenFlow was built backwards from the mistakes, and every fix is enforced by tests.
45×
Streaming logs re-report growing usage. Summing them read one real day as 82.8B tokens instead of 1.8B. TokenFlow collapses each monotonic run to its maximum, verified against an independent gateway billing log.
4 ≠ ∞
Fresh input, cache read, cache write and output are mutually exclusive buckets summing to the total. Cache refresh and reasoning are subsets, never added twice. Vendors disagree about input; both conventions are handled.
null ≠ 0
A source that does not report a field stores null, not zero. Sums skip nulls and carry a not-available counter, so averages are never dragged down by data that does not exist.
0 deps
No runtime dependencies, no network client anywhere in the codebase, server bound to loopback only. One grep proves it. Your raw logs never leave the machine.
Global activity
Local logs contain no request IPs, so TokenFlow never invents geography.
The map places each provider you actually used on its vendor-published datacenter regions —
and shows your own location only if you explicitly opt in with
map.showMyLocation. Nothing is captured per request; nothing is published.
Your AI usage tells a story. TokenFlow reads it honestly.
How it works
npm run setup asks each adapter to find its own logs in conventional
locations. Nothing is discovered by scanning your disk.
tokenflow refresh resumes each file at a byte offset. Unchanged files are
skipped entirely, so the second run takes seconds.
npm start serves everything at loopback:7799, or exports one self-contained
HTML file that opens anywhere, offline forever.
Install
brew tap vimoxshah/tap https://github.com/vimoxshah/tokenflow
brew install --cask tokenflow
npx @vimoxshah/tokenflow@latest setup
Download from the latest release.
Intelligence
Your AI week — requests, tokens, cost, peak day, week-over-week spikes — generated on a launchd schedule and delivered to your Telegram, inbox, or webhook. Opt-in per channel; always archived locally.
Set a monthly cap once. TokenFlow projects month-end spend from your real velocity and warns you before you cross it — approaching, projected-over, and actual-over states, each alerting exactly once.
Which model actually costs you what? Cost per request, tokens per request, cache-hit rate — computed from your own transcripts, never vendor marketing.
Strictly opt-in. Prompts become one-way hashes grouped into categories — code review, debugging, docs — so you see where the money goes without ever storing what you typed.
Laptop plus desktop? Sync daily totals through any folder you already share (iCloud, Dropbox, Syncthing). Daily numbers only — never prompts or code. Off by default.
Per-developer usage from the same shared folder — but a name shows up only if that
developer chose to publish it (sync.developerName). Anonymous machines stay in
team totals, out of per-person rows. Opt-in per person, by design.
tokenflow diagnostics shows version, providers, data freshness, and every
feature state locally. Nothing is transmitted; sharing an export is always your call.
Sources
| Claude Code / Agent SDK | ~/.claude*/projects/** | full per-request tokens including long TTL cache writes |
| Codex CLI / IDE / Desktop | ~/.codex/sessions/** | per-turn tokens, OpenAI inclusive input handled correctly |
| OpenCode | opencode.db | per-request tokens plus gateway routing |
| Hermes | ~/.hermes/state.db | per session per model tokens and measured cost |
| Cline | sessions dir | activity only; missing token counts stay missing, never zero |
| Cursor | ai-code-tracking.db | AI authored edits with per commit attribution |
| Gateways | e.g. Headroom JSONL | measured cost as overlay records, excluded from token totals |
| Anything else | CSV · JSONL · SQLite | a saved field mapping, no adapter needed |
Questions
No. There is no HTTP client in the codebase at all. Adapters read token counts and metadata and discard prompt text, source code and file contents. Everything lives in ~/.tokenflow which you can back up or delete.
The app is unsigned because there is no Apple Developer account behind this free project. Right click the app, choose Open, then Open again. That gate appears once only.
No. The DMG build embeds everything it needs and can drive refresh, watcher and dashboard itself. The CLI path exists for people who prefer it and for Linux and Windows.
Sources like Cline get activity metrics only. Missing token fields stay null rather than zero, so averages are never dragged toward zero by data that does not exist.
Every built-in rate records its source URL and fetch date. Service tiers are applied as multipliers per request. Models without a published rate show blank with a reason.
Free and open source under MIT. Your tokens never leave your machine.